Wireshark
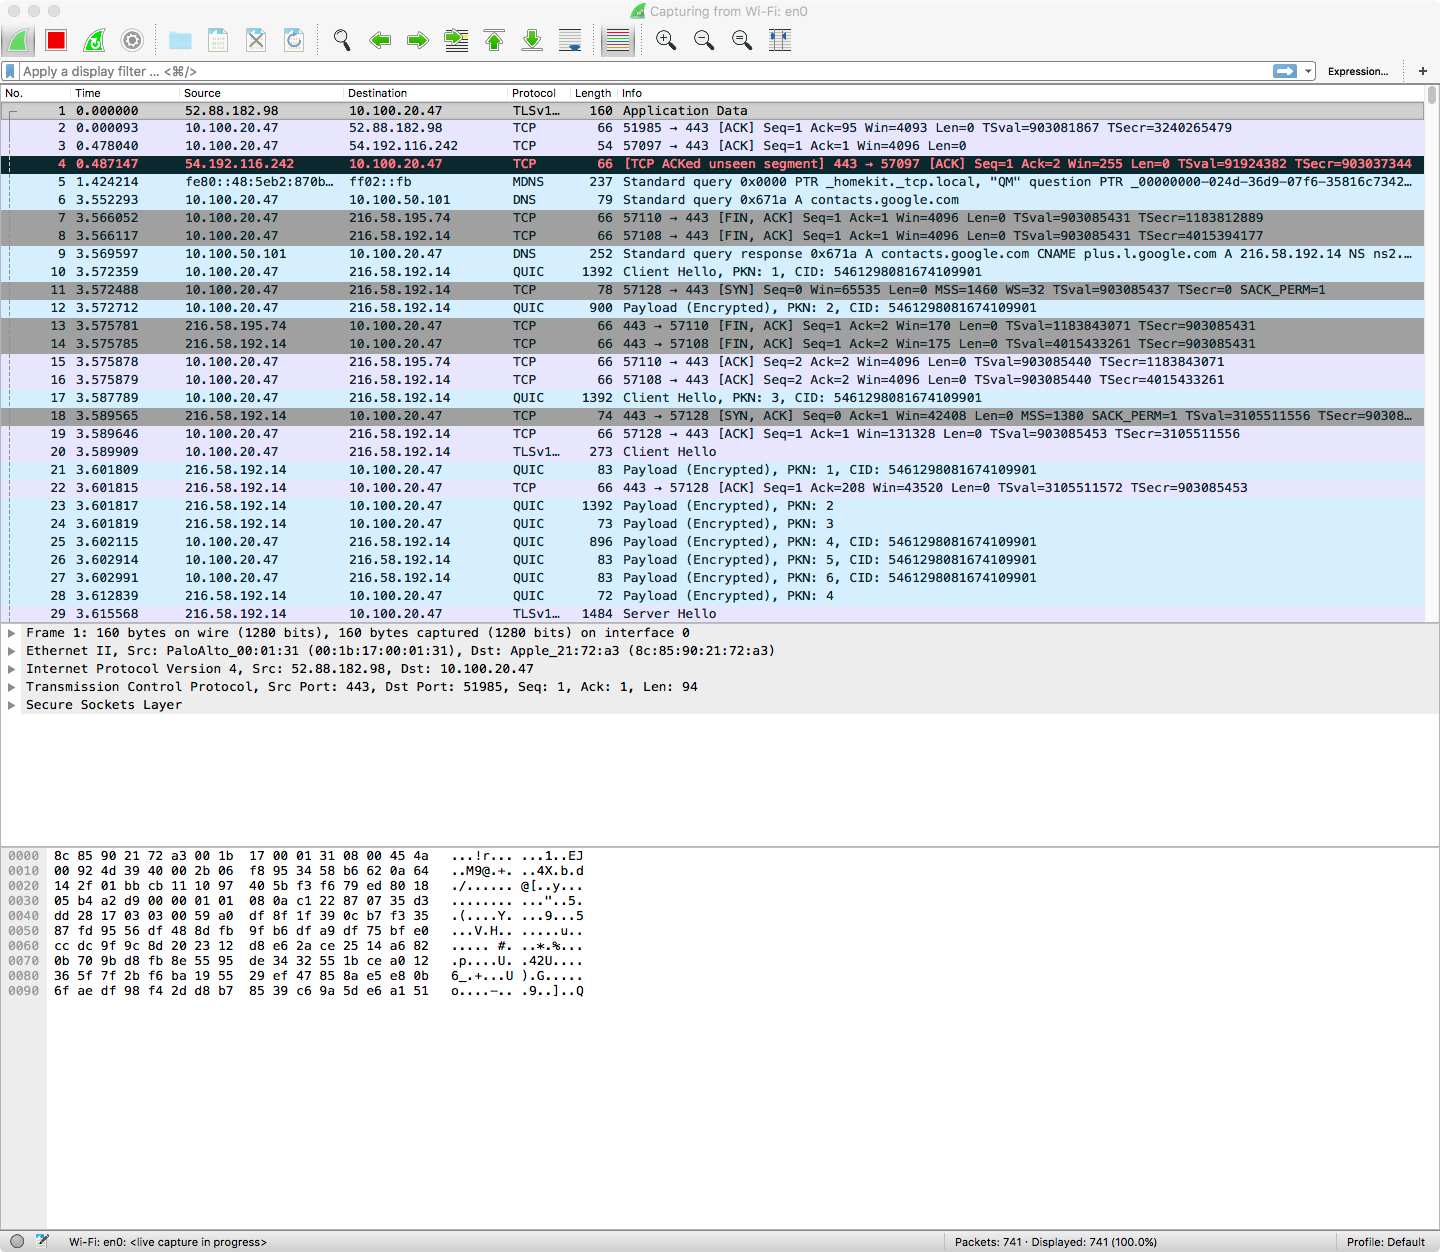
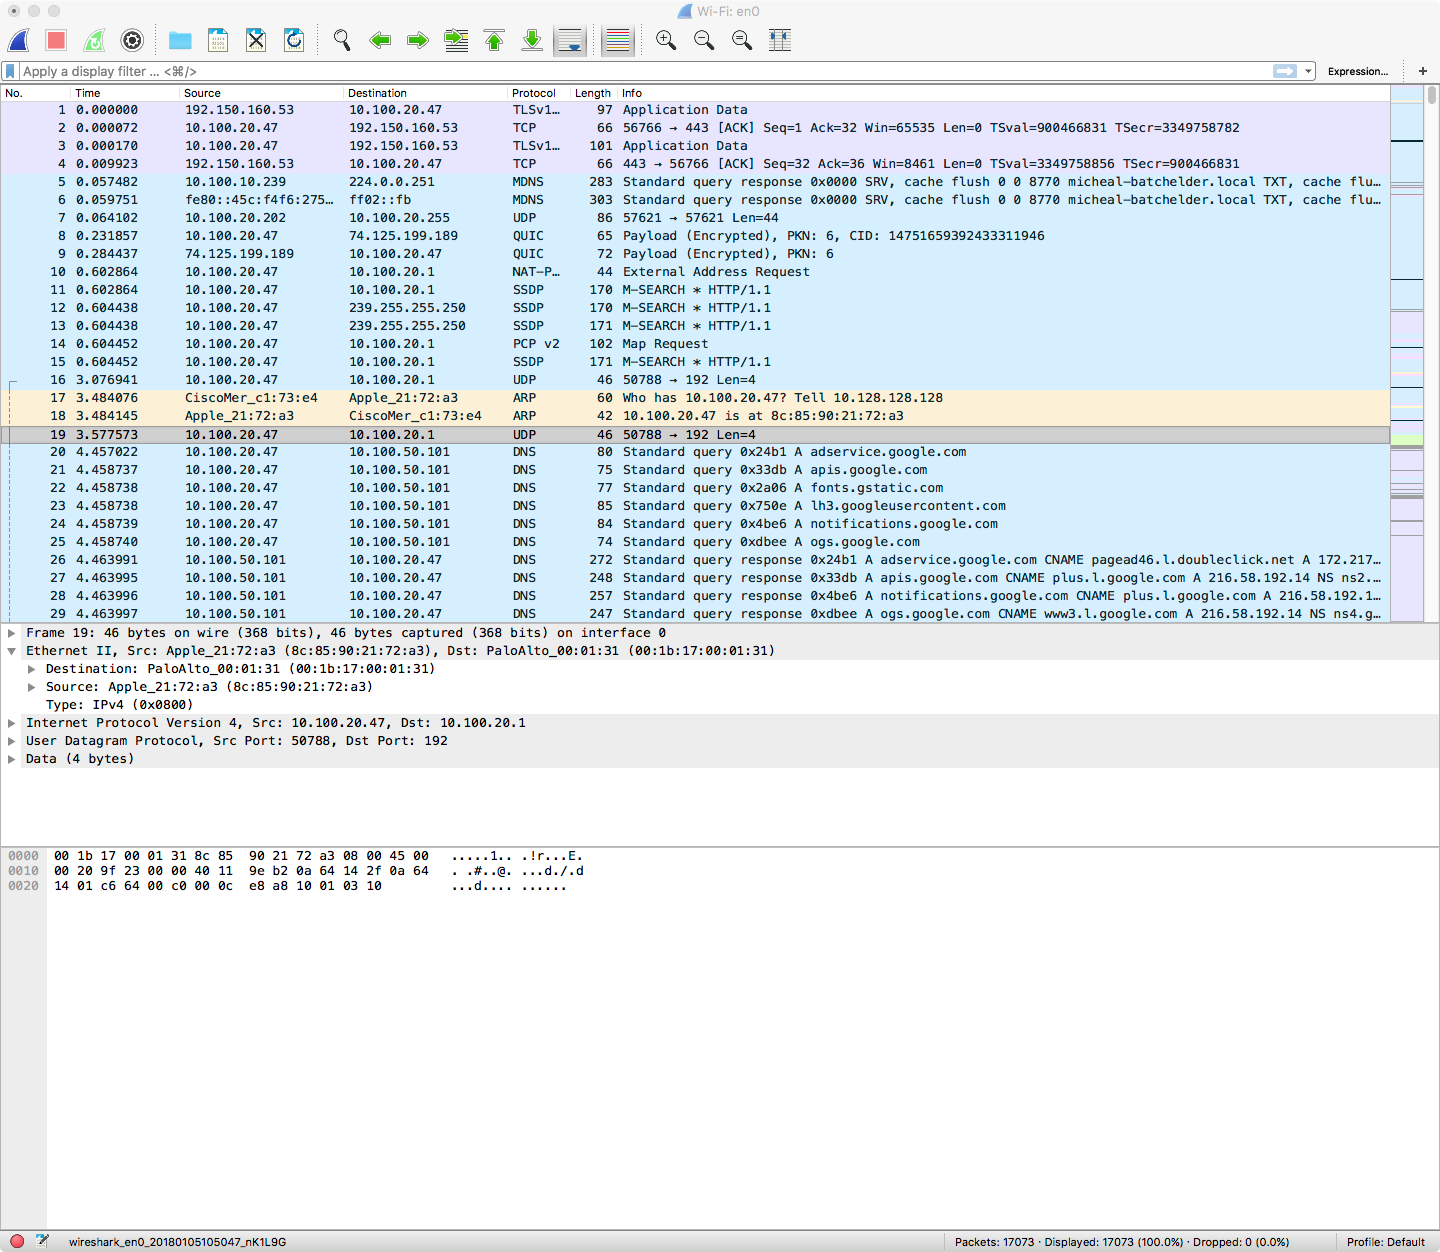
Wireshark(and its accompanying tools) is an application for capturing, reassembling, and displaying network traffic. Its power(when compared with other pcap tools) lies in its structuring of packet information into hierarchical and relatively intuitive groupings of data(figure below), as well as giving a color-coded, sequential view of the traffic.
Wireshark can be used to extract data directly from HTTP traffic, metadata from HTTPS traffic, and to identify places where traffic is being blocked or failing. It can also be used to diagnose certificate issues, as certificate error information is often not displayed by programs using SSL/TLS encryption.
Getting Started
Upon launching Wireshark, you will be presented with all the network interfaces on your computer which Wireshark can capture traffic on.
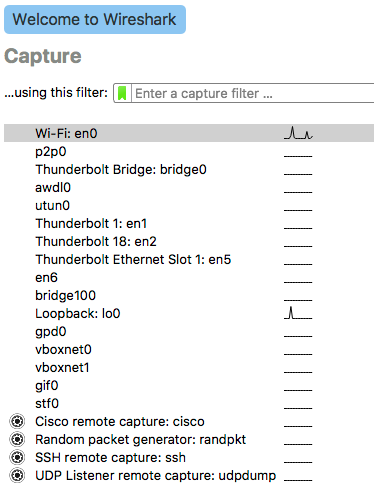
After selecting one(Wi-Fi: en0 in this case), Wireshark will switch to the main viewing pane, and traffic will begin to populate in(assuming any is moving). Note that on WiFi, you will need to put the card into “monitor mode” in order to see packets sent to other computers. This is because your NIC automatically filters out packets not sent to that NIC’s MAC before passing it up the stack to your applications when not in monitor mode.
Filters and Streams
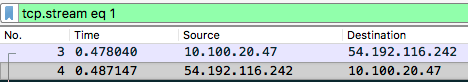
When viewing traffic, especially in monitor mode, there will be too many interleaved streams at play for you to sort through efficiently. This is where filters and stream-traces are useful, as they allow you to reduce the view to either a specific interaction:
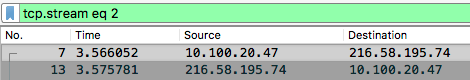
or by streams, which you can then iterate through manually:
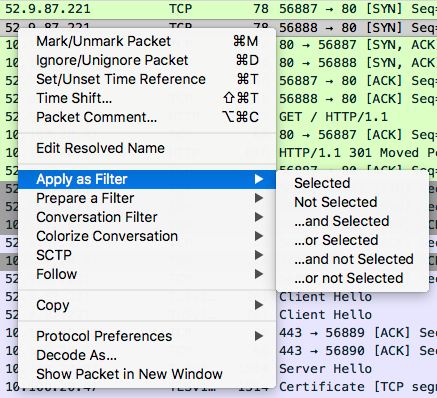
You can either create these filters by typing in the filter bar manually, or by right-clicking on the aspect of a packet you wish to filter on, and applying that as a filter.
HTTP/S Session Analysis
For this example, we’ll begin with a packet capture which contains a simple web browser connection to a webpage.
Here is our starting, unfiltered view:
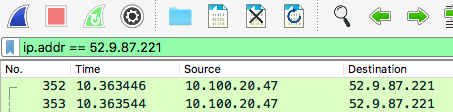
In this example, we’ll assume we know the IP address of the server we’re wanting to see the traffic to/from: 52.9.87.221, an AWS server based on the IP.
We’ll apply that as a filter(not direction-specific e.g. ip.dst for destination only) as we saw earlier:
There is a lot of traffic, but if we just right-click on the first packet and select Follow > TCP Stream…
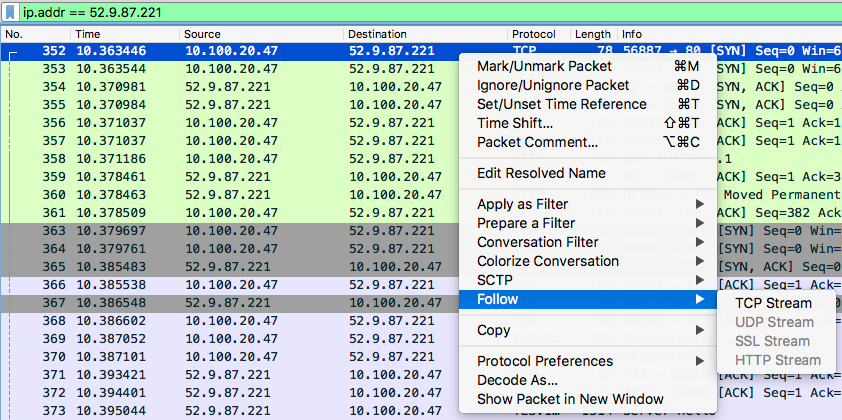
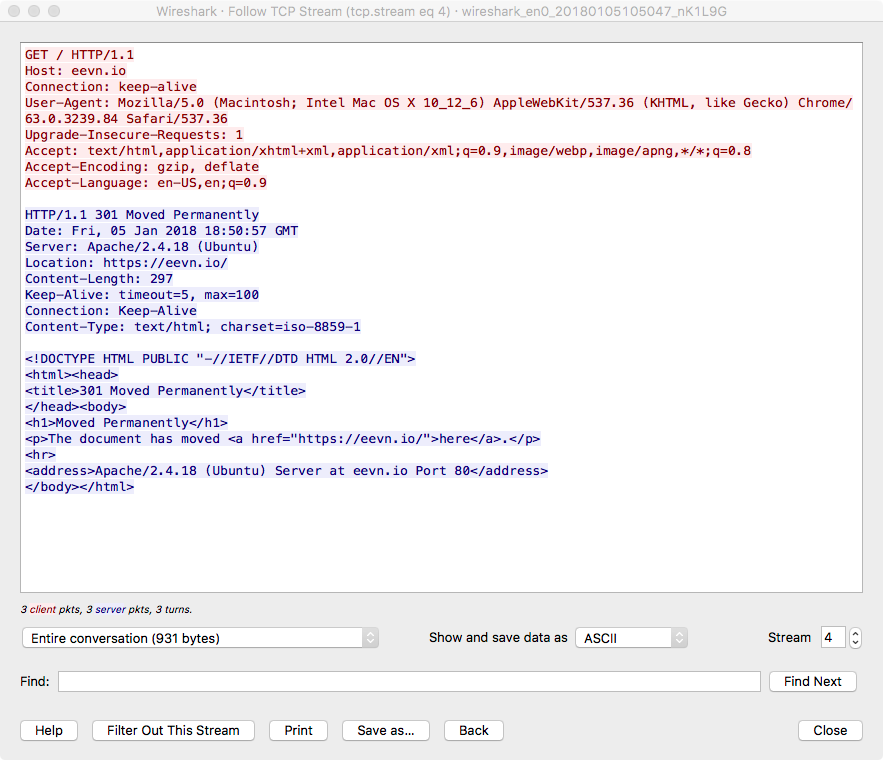
we’ll get a popout window with a view of the ASCII text of the HTTP traffic in that TCP stream:
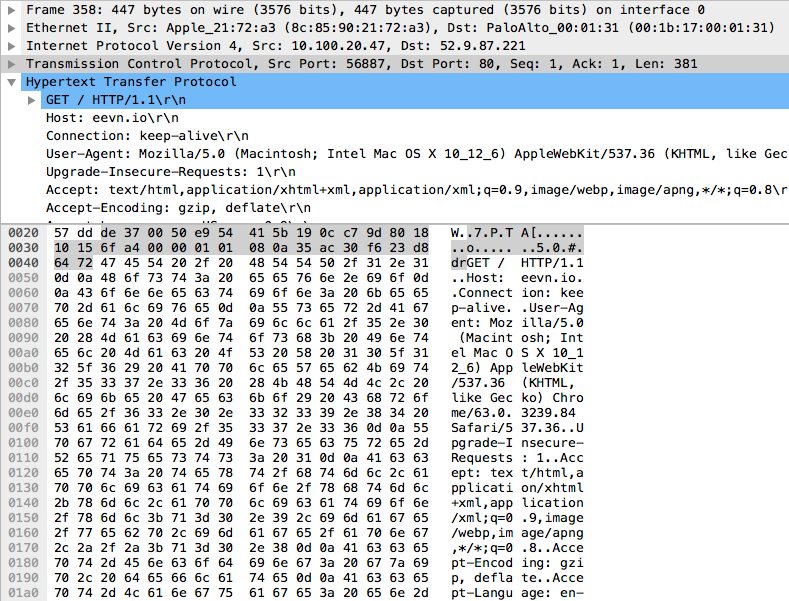
If we go back to the traffic view pane, we can pick out the packets that make up this exchange fairly easily:

and if we click on packet #358(far left column is the packet number), we can see the HTTP request in the packet itself.
Do the same for packet #360, and we can see the 301 Redirect response.
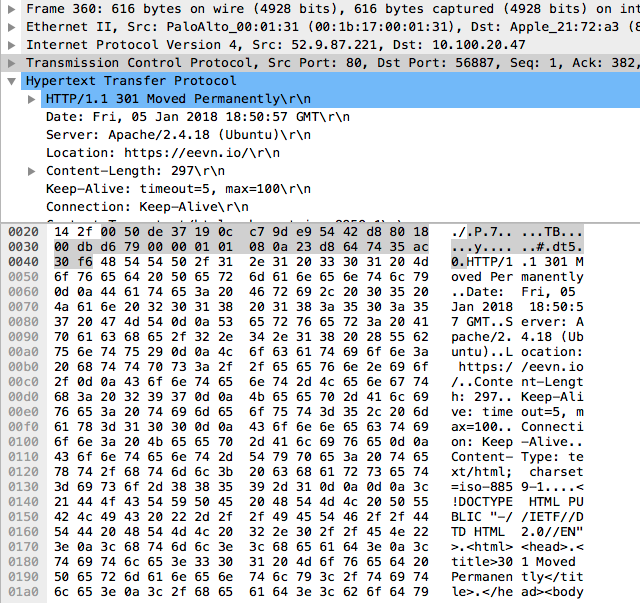
As we can see, the request for http://eevn.io is being redirected to https://eevn.io.
SSL Traffic Dissection
At this point the conversation is going to be encrypted, but there is still a lot of useful metadata which can be extracted very easily, even without diving into DPI(deep packet-inspection… which you can absolutely do by hand in Wireshark!).
First, let’s take a look at the basic anatomy of a TLS handshake:
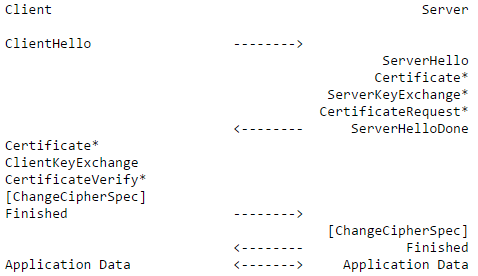
More information can be found here, but the basic gist is that
- The client sends the server a “hello” packet with
- its list of available cipher suites
- The server replies with
- its cipher of choice from that list
- its key
- its cert
- The client
- acknowledges the cipher choice(or disagrees, and they do this step again)
- sends its key
- verifies the cert
- The server locks in the cipher choice and initiates sending application data
Dissection Example
Two important things to keep in mind here:
- Wireshark is not perfect in packet ordering; it is basing it off of sequence numbers and time at which it saw the packet
- There are 2 distinct SSL handshakes taking place concurrently here, and they are interleaved
If we look at this section following the plaintext HTTP packets performing the redirect(packets #358-361), we’ll see this:
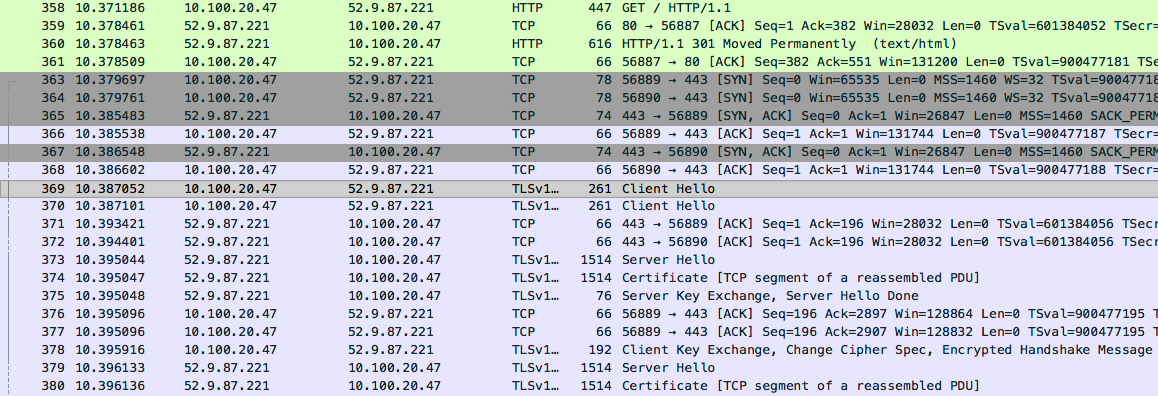
What’s happening, packet-by-packet
We’ll use "_A"(and highlighting) to designate conversation 1, and “_B” to designate conversation 2. It’s easier to understand if you only read the highlighted lines.
363_A : Client sends TCP SYN packet to port 443 on server
364_B : Client sends TCP SYN packet to port 443 on server
365_A : Server sends TCP SYN-ACK to client
366_A : Client sends TCP ACK. First TCP connection is established fully.
367_B : Server sends TCP SYN-ACK to client
368_B : Client sends TCP ACK. Second TCP connection is established fully.
Up to here, this is the same as any TCP connection.
369_A : Client sends first SSL "Hello" packet to server, list of ciphers
370_B : Client sends second SSL “Hello” packet to server, list of ciphers
371_A : Server ACKs(acknowledges) first "Hello"
372_B : Server ACKs second “Hello”
373_A : Server sends "Hello" in response to client's first "Hello", cipher of choice
374_A : Server sends SSL cert
375_A : Server sends key. Server Hello is complete.
376_A : Client sends ACK
377_A : Client sends ACK
378_A : Client sends keys, cipher acknowledgement, and encrypted message to verify SSL working
379_B : Server sends “Hello” in response to client’s second “Hello”, cipher of choice
380_B : Server sends SSL cert
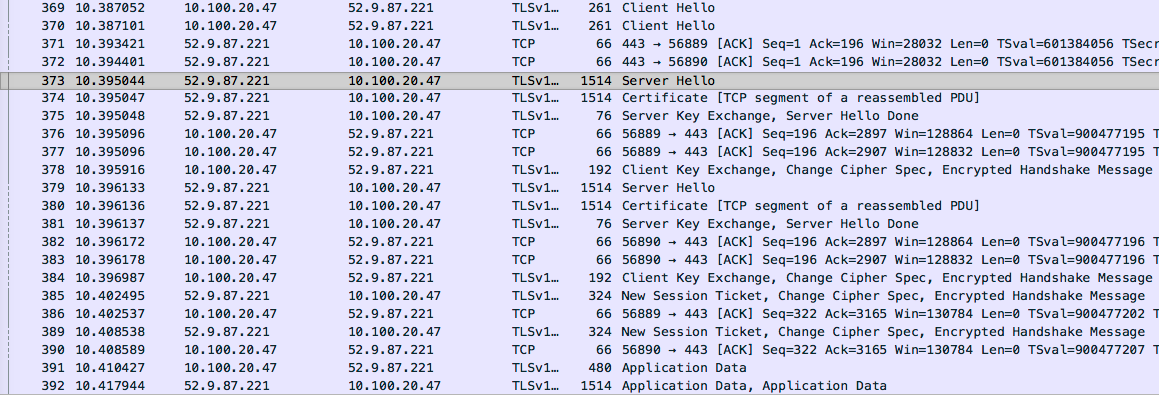
381_B : Server sends key. Server Hello is complete.
382_B : Client sends ACK
383_B : Client sends ACK
384_B : Client sends keys, cipher acknowledgement, and encrypted message to verify SSL working
385_A : Server sends finalization/ticket for session 1, cipher acknowledgement, and encrypted message to verify SSL working
386_A : Client sends ACK
387_x : Missing
388_x : Missing
389_A : Server repeats finalization from packet #385 <= At this point, the first SSL session is completely established.
390_A : Client sends ACK
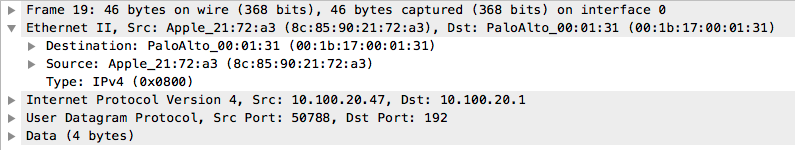
391_A : Client sends application data (appears to be the request for the actual page, i.e. https://eevn.io/)
note: How can we infer this without being able to see the plaintext HTTP? Apart from knowing that the page request is the first thing made after the SSL session is established, we can also see that the only other packet close to this size(480 bytes) is the original HTTP request(447 bytes). Considering the extra characters and the addition of some SSL session info, this makes sense in accounting for the size increase. This is how a lot of DPI works; ordering, metadata, and traffic pattern inferences.
392_A : Server sends application data